

Background: A prominent real estate agency seeks to optimize its property pricing strategy to ensure optimal market rents and minimize time on the market. Leveraging aNumak & Cpmapny’s consulting, the agency aims to uncover complex relationships between various property features and rental prices, providing insights beyond simple correlation analysis.
Data Overview: The agency possesses a comprehensive dataset with over 5000 rows and 7 variables:
number_of_rooms: Total number of rooms in the propertynumber_of_bathrooms: Total number of bathroomssqft: Total area of the propertylocation: Classified as “great,” “good,” and “poor”days_on_market: Days from listing to rentalneighborhood: The actual neighborhoodrental_price: The actual rental price
Insights from Correlation Analysis: Upon uploading the dataset, the agency performed a correlation analysis, revealing the following insights:
- Positive correlations: Number of rooms, area, and number of bathrooms.
- Negative correlation: Days on the market.
Linear Regression Analysis: The linear regression analysis further delved into these correlations, providing regression coefficients. Notable findings include:
- Each additional bedroom increases rental prices by $1,079 per month.
- An extra square foot contributes an average increase of $3.3 per month.
- Each day on the market correlates with a decrease of $21 per month in rental prices.
Non-linear Regression Analysis with Actable AI: To unveil more intricate relationships, the agency utilized Actable AI’s non-linear regression analysis. This allowed for predicting rental prices by selecting relevant predictors and offering a user-friendly interface.
Key Features of the Non-linear Regression Analysis:
- Prediction Model Building: Users can easily choose rental price as the prediction target and other relevant variables as predictors.
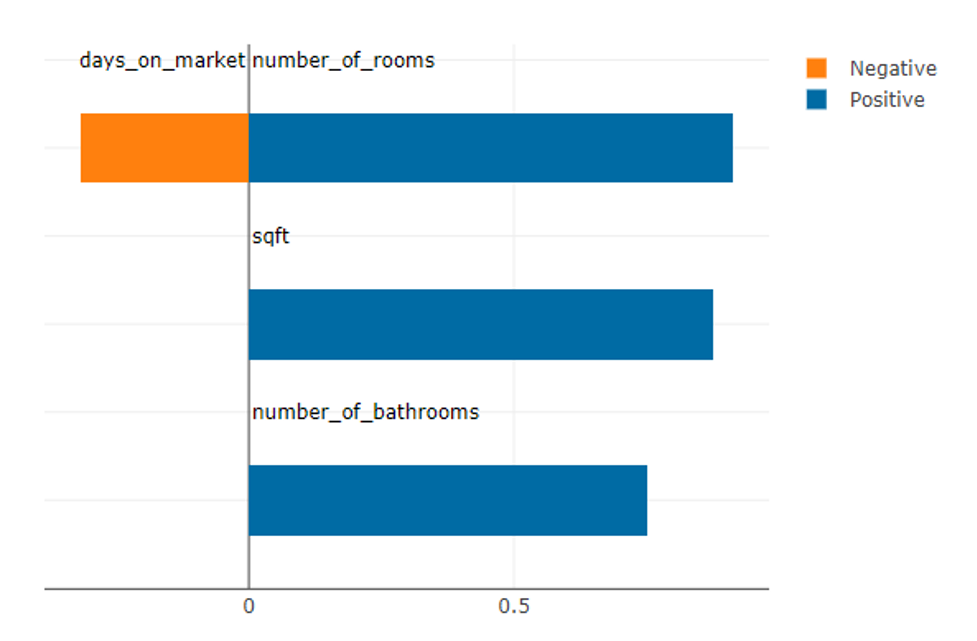
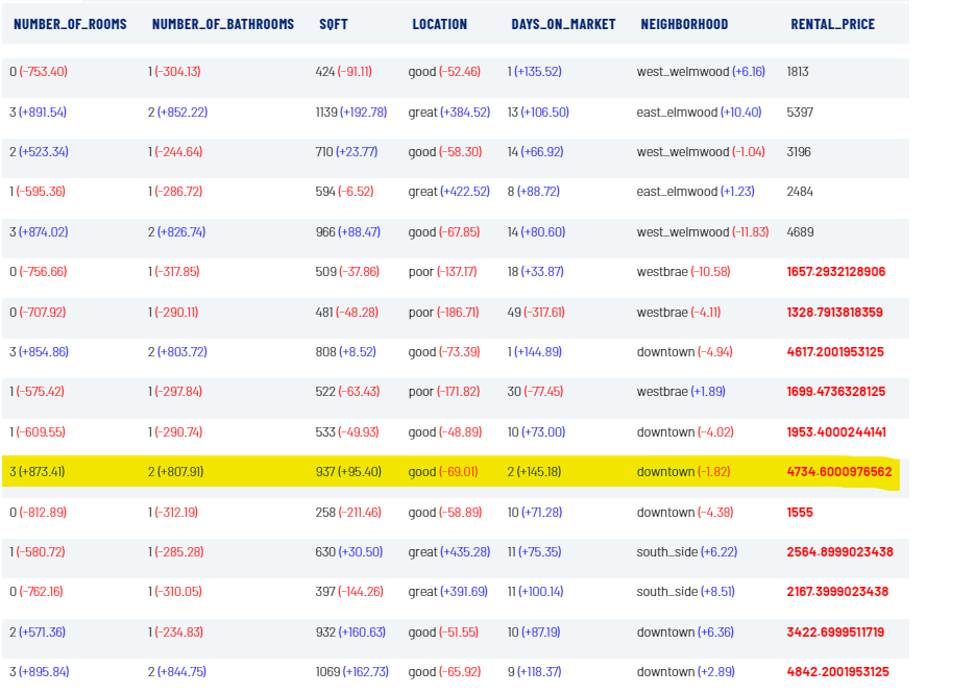
- Shapley Values Interpretation: The analysis returns predicted results along with Shapley values, indicating the contribution of each predictor to the final prediction.
Example Output: For instance, the predicted rental price of a property is $4,734.6. The analysis highlights that having 3 bedrooms adds $873.4 compared to the average rental price, while the downtown location reduces the price by $1.82.
Model Performance: The analysis assesses the model’s performance on a validation dataset, demonstrating:
- High predictability (R2 of 0.99, where the max is 1).
- Low root mean square error (RMSE) of about $45.3.
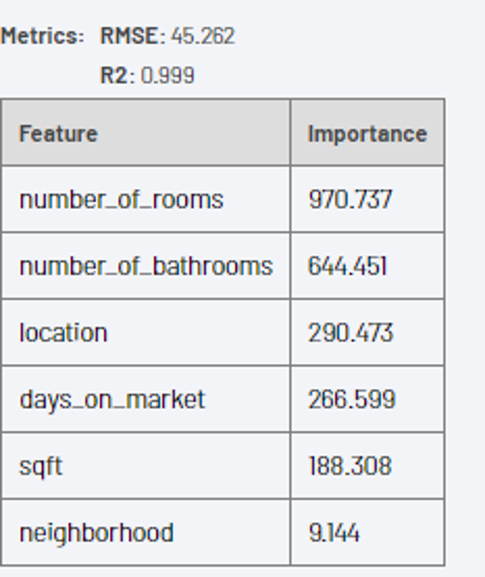
Key Predictors: The model identifies the most influential predictors for rental prices, ranking number of rooms, number of bathrooms, and locations as the most significant factors.
Conclusion: aNumak’s consulting on regression analysis empowers the real estate agency to refine its pricing strategy effectively. The model captures linear relationships and uncovers nuanced connections, enabling the agency to make data-driven decisions and optimize rental prices for faster market penetration and increased revenue.
